Depth of Market (DOM) Trading
Introduction to DOM Trading for Beginners
DOM trading is a technique used by traders to analyze the order book of a particular asset. The order book shows the current buy and sell orders at various price levels, helping traders understand market liquidity, order flow, and potential price movements. In this guide, we'll break down DOM trading in simple terms to help beginners grasp the basics and see how it can be used to make informed trading decisions.
What is Depth of Market?
DOM is like a real-time map of buy and sell orders for a specific asset, such as a stock or a cryptocurrency. This map shows how many units of the asset are being offered at different prices. Imagine you're at a market with stalls selling apples. Each stall has a different price and quantity of apples. The DOM is like a list of these stalls, showing how many apples are available at each price point.
How Does DOM Trading Work?
When you look at the DOM, you see a list of prices and the number of buy and sell orders at each price. Here’s how it works:
- Buy Orders: These are the orders from people who want to buy the asset. They are listed with the quantity they want to buy and the price they are willing to pay.
- Sell Orders: These are the orders from people who want to sell the asset. They are listed with the quantity they want to sell and the price they are asking for.
By examining these orders, traders can gauge how many people are willing to buy or sell at different prices. This helps them understand the supply and demand for the asset, which can influence its price movements.
Example: Iceberg Orders
An iceberg order is a special type of order used in DOM trading. It's called an iceberg order because, like an iceberg, only a small part of it is visible above the surface, while the larger part is hidden. Here’s how it works:
- Visible Portion: When a trader places an iceberg order, only a small part of the total order is visible to the market.
- Hidden Portion: The rest of the order is hidden. When the visible part gets filled (i.e., someone buys or sells the visible portion), another part of the hidden order becomes visible.
This technique helps traders avoid showing their full order size to the market. By doing this, they can buy or sell large quantities without causing a big impact on the asset’s price.
How to Start with a DOM
For beginners, the DOM can seem like a lot of numbers and data. However, it’s a powerful tool that provides a clear picture of market activity. Here are a few tips for using DOM in your trading:
Understanding Depth of Market (DOM) in Trading Software
Every trading software focused on depth of market (DOM) has its own nuances. While these nuances can be a bit complicated, understanding them is crucial for effective trading. Here's a structured guide to help you navigate these complexities.
Study the Software Manual
It's essential to thoroughly study the software manual of any trading platform you use. Each software may have different tools and terminologies, so familiarizing yourself with these specifics will help you use the platform more effectively.
Despite the differences among various trading platforms, the fundamental concepts remain consistent. Here are the key elements you need to understand:
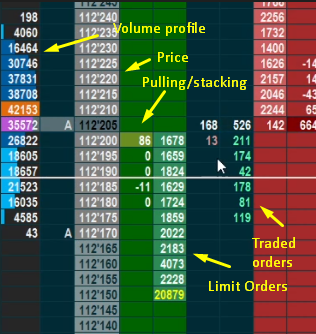
Buy/Sell Limit Orders
These are waiting orders that will be filled when the price reaches a specific level. Understanding where these orders are placed helps in predicting potential price movements.
Market Orders at Certain Price Levels
This refers to the number of contracts traded at a particular price level in real-time. Observing market orders provides insights into the market's current demand and supply.
Volume Profile
The volume profile shows how many contracts were traded at each price level throughout the day. This information is valuable for identifying significant price levels and market trends.
Pulling and Stacking
Pulling: This indicates how many contracts were removed from a certain price level.
Stacking: This shows how many contracts were added as limit orders to a particular price level. Monitoring pulling and stacking activities can give you clues about potential price reversals or continuations.
