Technical Analysis
Technical analysis is a methodology utilized by traders and investors to dissect financial markets and predict future price movements based on historical price data and market statistics.
The main components of technical analysis comprise indicators and chart patterns. Indicators encompass mathematical calculations applied to price data to generate signals about the direction and strength of price movements. Ranging from simple moving averages to complex oscillators, indicators aim to provide insights into market trends and momentum. Among the most commonly used indicators is VWAP.
Chart patterns, on the other hand, are identifiable patterns observed with the naked eye on a computer screen. These patterns repeat over time, forming the basis for their implementation. Recognizing a pattern involves understanding its repetitive nature and assuming the next price movement based on historical behavior when the pattern occurred. Examples of chart patterns include the double top/double bottom or the 123 pattern.
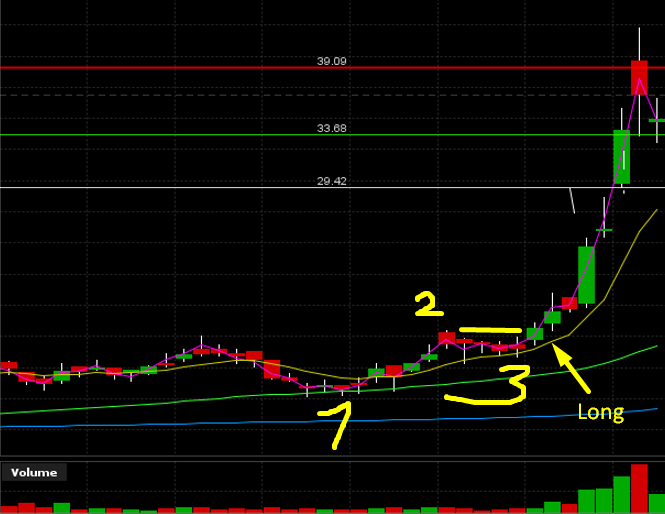
Example of Technical Analysis - 123 Pattern Description
- Leg 1 (Point 1): Initial upward movement starting the pattern.
- Leg 2 (Point 2): Pullback forming a higher low.
- Leg 3 (Point 3): Upward movement forming another higher high.
Entry Signal: Break of the high of Leg 2 (Point 2) indicates a long entry.
Customizations: Adjust pattern size, candle numbers, and entry points. Combine with indicators like SMA.
Indicators on Chart: SMA lines show trend direction and support/resistance levels.

Personally, I consider technical analysis to be the most potent trading tool in my arsenal. However, it can also be combined with other trading techniques, which we will explore in subsequent chapters.